 Mainstream Weekly
by S.C. Sharma
The following is a study based on the results of a field survey undertaken by the author for the Research Project “Impact of NREG Scheme on Rural Economy of Punjab: A Case Study of Three Districts“. The project was funded by the UGC, New Delhi.
Introduction
Numerous studies have been undertaken to assess the impact of the NREGA scheme on poverty, gender equity and asset creation among all the States having implemented the scheme including Punjab. The review of literature carried out from time to time has highlighted the importance of this scheme to the lives of the poorest of the poor of this country. [Dreze and Sen (2013). Sameekksha (2012)] The literature however suggests that States with political commitment of their own or through the intervention of civil society or workers’ unions have succeeded in implementing the scheme in a much better way as is shown by its performance in terms of the employment generated. [Manor (2010) quoted in Diago Malorana (2014)] There is also evidence from some other studies which suggest that while there is a serious problem of unemployment among rural workers, the employment provided under the scheme has been very low. Punjab is one among such States. [Amrender Reddy, (2015) and Sharma (2014)]
Based on a survey of 532 beneficiaries of the NREGA located in 47 villages across three districts of Punjab, we bring together the socio-economic characteristics of these beneficiaries and use the demand for work implicit in their socio-economic characteristics and also captured by their responses to the question: If given a chance to work beyond 100 days under the NREGA how many days would they prefer to work? Being a low-performing State we then raise the question: why is there so low man-days of employment even when there is enough demand? While answering this question we hypothesise that in Punjab there is information asymmetry implicit in the poor awareness among workers about the rights provided to them by the Act and low levels of education of the Gram Panchayat sarpanches. This information asymmetry is taken advantage of by the landowning classes and is used by them to their advantage by coercing the sarpanches for not creating the needed mandays.
Sample Design and Basic profile of NREGA Workers
Sample descriptions are provided below along with their socio-economic characteristics. The distinguishing character of the sampled bene-ficiaries is that it represents all the three geographical zones of Punjab: Doab (Hoshiarpur), Malwa (Muktsar) and Majha (Amritsar). These three zones also represent three socio-cultural zones. The selection of villages is a simple random selection. It has, however, been ensured that the villages covered provide a fair representation of the district. Similarly, the beneficiaries of the study are also randomly selected ensuring a sample size in proportion to the beneficiary and non-beneficiary households in each district. An overview of the geographical spread of the sampled workers (Table 1) reveal that it represents a comprehensive coverage of the State. The description of their socio-economic backgrounds help in understanding if the scheme has reached the intended section of the society. With this end in view we find from the data that: 77 per cent of all workers (beneficiaries) belong to 18-55 years of age. (See Chart 1) Workers in this age-group in Amritsar and Hoshiarpur are 79.3 per cent. In Muktsar this percentage is 74 per cent. Muktsar provides another distinct feature of workers. About eight per cent of the sampled workers belong to the 66-75 age-group while in the other districts this per cent is quite low: 6.6 per cent in Amritsar and 4.5 per cent in Hoshiarpur. The necessity to take up manual work at this age, which is much beyond the average Indian age, indicates the level of their poverty and deprivation.


When participating workers are identified on the basis of gender (Chart 2), it provides us with an interesting insight. The per cent of all women workers in the three districts together is 47.7 per cent. The per cent varied quite sharply with 33.1 per cent in Amritsar to 59.8 per cent in Muktsar. This data, collected from sampled workers, support our impression, gathered during the survey, that women in some parts of Amritsar do not move out of their homes for work. This, however, is not the case in the other two districts. In Muktsar participation by women workers is quite significant, if not phenomenal. Taken together, the results show that the NREGA has reached its intended population—women—a move towards gender equity.


Some other beneficiary household characteri-stics are provided in Charts 3, 4 and 5. A look at Chart 3 reveals that majority households of our sample are residents of their own villages. This became more clear when a question was asked: if they have migrated permanently or have come here only for a few months, to those who had answered “yes” to the migrant question. The respondents were unable to answer such a question. The data on yes (Chart 3) is therefore an aberration in the responses as discussion with GP officials did not reveal much except that few families migrated to these villages long back for different reasons and have settled permanently in these villages.
Continuing further with the workers’ profile, a majority of the workers are of Sikh religion in Amritsar and Muktsar (66.9 per cent and 93.5 per cent respectively). In the Hoshiarpur district the workers are of Hindu religion (87.7 per cent). Some 23.1 per cent of the sampled workers were from Christian households also. (See Table 2)1 The proportion of the sampled workers belonging to different religions is only a reflection of the dominant proportion of population of the respective religion in these districts.

Further analysis of the socio-economic background of the sampled workers in Punjab reveals that they are predominantly from SC households. A look at Chart 4 shows that the NREGA has reached the marginalised sections of the population (SC) in a big way—as many as 86 per cent of the total beneficiaries are from this section. Unlike other regions of the country, the majority, however, live in semi-pukka houses (self-owned), hold atta dal ration card. (See Table 3) Interestingly, marginalised sections (SC) among the sampled households, while better off in comparison to other parts of the country,2 being landless (see Table 4), speaks about the importance of the NREGA for such a section of the population. Charts 5 and 6 provide graphical representation of the type of houses they live in and the type of ration card they hold.
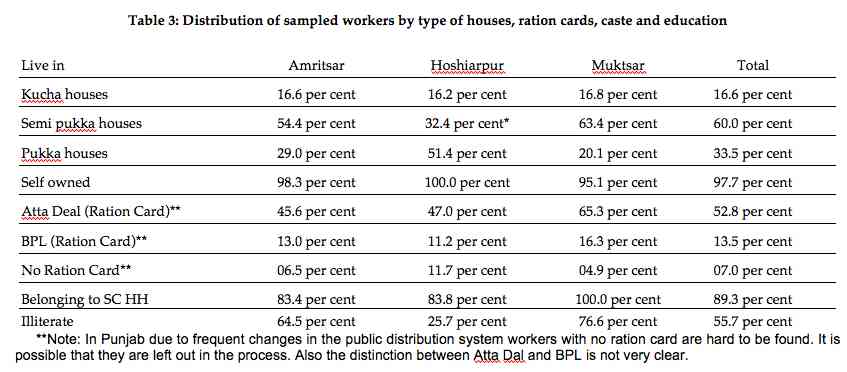
**Note: In Punjab due to frequent changes in the public distribution system workers with no ration card are hard to be found. It is possible that they are left out in the process. Also the distinction between Atta Dal and BPL is not very clear.


The economic background of the workers is also described using the following measures:
(a) Land-owning status
(b) Ownership of livestock
(c) Household assets
(d) Household’s main occupation.
The data contained in the above table reveals that a large majority of the sampled worker households are landless.3 Through the survey an attempt is also made to find out if there was any system of leasing-in of land by the landless households or by those who had some lands in Amritsar and Hoshiarpur. The information gathered reveals that the system of leasing-in was practically non-existent in the two districts where respondents owned some land or even otherwise.
Further, as many as 59.2 per cent households in Amritsar, 49.2 per cent in Hoshiarpur and 45.2 per cent in Muktsar among the sampled households did not own any livestock.4 Data on the household assets reveal that the rural life is not in any way much different from that of the semi-urban life. The main occupation among the sampled workers across the three districts is agricultural labour, more pronounced in Muktsar followed by Amritsar and Hoshiarpur.


The economic background of the workers is also assessed by looking into the extent of their indebtness for which an analysis of the source of loan, purpose of loan and the rate of interest was carried out. (See Tables 5, 6 and 7)
The data show that among the sampled households the extent of indebtness is not widespread. Of the total households across the three districts, households under loan were only one-fourth with a maximum of 32.5 per cent in Amritsar, 15.1 per cent in Hoshiarpur and only 28.3 per cent in Muktsar. When sources of loan among the indebted households were analysed, the following emerged. (See Table 6)
A quick glance provides three contrasting features. The presence of the lock-in/tie-up system, both in Amritsar and Muktsar, is more pronounced in Muktsar. This is shown by 44.4 per cent of households in Muktsar having taken loan from their employers/landlords as compared to 30.9 per cent in Amritsar. The Hoshiarpur district was free from this system. Secondly, the professional money-lender could still be seen accounting for loan to 20.0 per cent of the indebted households in Amritsar and 48.1 per cent in Muktsar. This source was practically insignificant in Hoshiarpur. The third major source of loans is government/banks and cooperative societies/SHG. These two sources of loan were visible in Amritsar (36.3 per cent households) but quite significant in Hoshiarpur (81.4 per cent).


Continuing with the analysis of indebtness, the purpose of loan followed by the amount of loan and the rate of interest for the loans is provided in the next table. Among the purposes of loan, it was not possible to see any distinct order of ranking among the various purposes across districts but construction need (see Table 7) occupied the top priority for loans in both Amritsar and Muktsar. The proportion of households under loan in these districts is 37.0 per cent and 30.8 per cent respectively. In Hoshiarpur, 23.2 per cent of the indebted household loans were for social functions. Construction loans were taken by only 15.4 per cent households. In fact social function and medical expenses needs occupied two other purposes after construction. The three purposes taken together comprised of 68.5 per cent of indebted households in Amritsar, 57.8 per cent in Hoshiarpur and 82.7 per cent in Muktsar. An important outcome of this analysis is that household loan needs for consumption still persist although less severe than other needs. The amount of loan of the indebted families show that there was wide variation in the amount. (See Table 8)

The loan amount across the three districts varied between less than Rs 25,000 to more than Rs 3,00,000 in Amritsar, less than Rs 25,000 to upto Rs 3,00,000 in Muktsar. In Hoshiarpur the range was much smaller, that is, up to Rs 1 lakh only. But, as seen by its distribution among households, the distribution is highly skewed. It is highly concentrated up to Rs 50,000 among 68.5 per cent households in Amritsar, 92.3 per cent in Hoshiarpur and 77 per cent in Muktsar. The average amount per indebted household’s loan outstanding worked out to be Rs 65,963 in Amritsar, Rs 38,461 in Muktsar and Rs 26,923 in Hoshiarpur.
An attempt is also made to capture as far as possible the rate of interest being paid by indebted households. Both in Amritsar and Muktsar, where workers received loans from their employers/landlords, it was difficult to know the rate of interest as loans were provided as lock-in/tie up of the worker by the landlord. The rate of interest however varied between Rs 2 per month per Rs 100 to Rs 5 per month per Rs 100 in Muktsar and Amritsar. In Amritsar and Muktsar in some cases the rate of interest was quite high as about 30 per cent of the indebted households reported between Rs 6 per month per Rs 100 to Rs 10 per month oer Rs 100. We also looked into the savings pattern of the sampled households, only to find that a large majority of households across the three districts had no savings at all and those with some savings had kept it at home possibly against emergencies. There was no practice of keeping money in bank accounts. Even self-help groups had not created any impact except in Hoshiarpur where 16.2 per cent of the households had some savings with the SHG.
(See Chart 7)
In sum, workers’ profiles from our sampled households reveal the following:
- Majority of the sampled workers (79.3 per cent in Hoshiarpur and Amritsar, 74.1 per cent in Muktsar) belonged to the 18-55 year age-group across the three districts. Some small proportion of workers were in the age-group 66-75 across all the districts. It was eight per cent in Muktsar, 6.6 per cent in Amritsar and 4.5 per cent in Hoshiarpur. About 50 and 60 per cent of the workers were women in Hoshiarpur and Muktsar districts. This was about 30 per cent in Amritsar. Across all districts the sampled workers were permanent residents of their respective villages. Further, the majority belonged to either Sikh or Hindu religion. Some, however, belonged to the Christian religion as well. Christians were largely seen in Amritsar.

2. The majority of the workers lived in semi-pukka houses in Amritsar and Muktsar but pukka in Hoshiarpur. Some across the three districts lived in kuchha houses also. Almost all had self-owned houses and sizeable of them held Atta Dal and BPL Ration Cards. Though insignificant, some households did possess no Ration Card. They were largely illiterate in Amritsar and Muktsar but not in Hoshiarpur. The percentages of illiterates were 64.5 per cent, 76.6 per cent and 25.7 per cent in Amritsar, Muktsar and Hoshiarpur respectively.
3. The majority households are landless. The landless background of the households was 87.0 per cent in Amritsar and 98.4 per cent in Muktsar. This in Hoshiarpur was 89.4 per cent. Nearly half of the households did not posses any livestock. The main occupation of the respondent households was agricultural labour.
4. The problem of indebtness across districts is not widespread. The system of labour lock-in was seen in Amritsar and Muktsar. Workers to a large extent depended on their employers for loan. Though the problem of indebtness was not widespread, wherever households had depended on professional money-lenders, the rate of interest was exorbitant. Professional money-lenders were seen in both Muktsar and Amrtisar. In Hoshiarpur the source of loan was cooperative bank or SHGs. The indebted households’ main reason for loans was house construction, social function and medical expenses. The intensity of the purposes differed from district to district. The households also borrowed to meet their consumption needs but such households were not very large. The average amount of loan among indebted households was Rs 65,963 in Amritsar, Rs 38,461 in Muktsar and Rs 26,923 in Hoshiarpur but was concentrated around Rs 50,000 among 68.5 per cent households in Amritsar, 92.37 per cent household in Hoshiarpur and 77 per cent households in Muktsar. More than 85 per cent households in Amritsar and Muktsar and 75 per cent in Hoshiarpur had no savings at all.
5. Household assets in possession were as good as those possessed by any semi-urban poor (not destitute).
Socio-economic Profile of NREGA Workers and Demand for Work
Having provided the basic profile of the NREGA workers in detail we restate the landholding status and cast affiliation of the sampled workers which have a direct bearing on the demand for work. The data is reproduced in Table 9. The socio-economic backgrounds implicit in these data reveal that 86 per cent of the NREGA workers are from landless Scheduled Caste households. Being landless, their source of earning would be largely manual work (agricultural labour) or at best some skilled or semi-skilled work but the profile of the NREGA workers suggest that nearly sixty per cent of them with variations across districts are illiterate, meaning agricultural labour is the only source of earning for such workers. It is therefore reasonable to assume that since the NREGA as per its design is based on the principle of self-selection with dignity of labour, this section of workers would all the time be on the look out for NREGA work. This is also implicit in the NREGA workers’ gender distribution where as many as 47 per cent of the total sampled workers are women implying that the NREGA has provided a fillip to work demand as a large number of women are seen eager to participate.

Work Demand Based on Responses to Direct Questions
That there was demand for NREGA work is also culled from the workers’ responses when they were asked a direct question: how many days would they like to work under the NREGA if they are given a chance to work beyond the current 100 days in a year? The results are provided in the chart below which reveals 56.8 per cent and 66.5 per cent in Amrtisar and Muktsar convey the need to work between 251-365 days in a year. In Hoshiarpur 54.6 per cent preferred to work upto 250 days in a year. (Chart 8) Given such eagerness for work when we examine the data on employment generated, we find the number of days very low.

Employment Generated
The employment generation record of the NREGA in Punjab has not been satisfactory. Since the commencement of the NREGA in all districts of Punjab in 2008-09, the proportion of job-card holders provided employment has oscillated around 50 per cent.5 The primary data from the sampled workers is presented in Table 10. The proportion of the sampled workers who did not get employment under the NREGA has gone up between 2010-11 to 2012-13 in two districts: Amritsar and Hoshiarpur. Only about 39.1 per cent of the sampled workers were provided work in 2012-13 in Amritsar. This proportion is about 36.9 per cent in Hoshiarpur. The Muktsar district is relatively better in this regard, the proportion of the sampled workers provided employment here is about 58.7 per cent.

Considering that this proportion is of the sampled workers and not among all job card-holders, this proportion is still very low compared to the demand for work implicit in the number of job cards issued. Even among the sampled beneficiaries who got employment, the average number of days of employment never crossed 40 days in any of the districts in any of the years for which data was collected. (See Table 11) The data provided in Table 11, particularly for Amritsar, must be taken with an extra degree of caution as at various places of our survey, job cards were not only patchy in terms of the data on the number of days worked and wages received as was the case in the other two districts also but in Amritsar invariably job cards were not in possession of the beneficiaries and were with the sarpanch. At a few places the survey team observed that job cards were made a day or two before the survey team’s visit. Since we were unable to verify the responses from the workers’ job cards, the data provided in Table 11 must be taken as tentative for the very simple reason that we were looking for employment for three years which they found difficult to recollect and verification from the job cards was not possible.
The data, however, revealed the declining trend in employment generation under the NREGA. Though the pattern of decline is not consistent, the number of days of employment even among those who got employment is very low. The other features of the employment generation across all the districts reveal that there is a differential pattern: some areas getting more work and some areas less work during a given year. In none of the districts the number of days of employment can be said to be anywhere near the guaranteed 100 days. When such a situation is seen in conjunction with the large number of job-card holders not getting work at all, one need not have to look for factors that would discriminate among workers while allocating work. We may call this a situation of rationing in Punjab. Rationing is simply because of lesser number of days of work generation and not discrimination in work allocation.

We checked the findings of the survey with the NREGA website data on mandays generated for the last five years. (See Chart 9) This data on average mandays for each of the years after peaking in 2010-11 does not show any consistent pattern. The rate of decline has been quite sharp in Amritsar but much less in Muktsar than in Hoshiarpur. These data only suggest the receipt of some additional income/employment provided by the NREGA. Its impact on poverty and deprivation cannot be substantial. These results along with workers’ perception, described in Tables 12 and 13, can only be interpreted as not much of an impact on the quality of life as they are also indicative of high hopes and low performance.
Workers’ Perception about NREGA
How workers perceive the NREGA is another qualitative aspect of the NREGA’s importance for their lives and was assessed using a set of questions such as: (a) why did they join the NREGA, how important is the NREGA to their family and what significant changes has the NREGA brought to their family’s life?
Why did they Join NREGA?
The workers were given a choice to make and the first three preferences in order of their ranking were noted. The ranking indicates that the NREGA being primarily a wage-earning opportunity either the work is available at the doorstep or it is a government employment and the NREGA work requires no special skills as was stated by 48.5 per cent of the sampled workers in Amritsar. In Hoshiarpur, in

addition to the first two choices of the Amritsar workers, the NREGA providing guaranteed employment for 100 days and equality of wages were two other preferences of 67.5 per cent of the sampled workers. In Muktsar only 27.7 per cent of the sampled workers revealed their preferences. (See Table 12) The choices given were:
1. NREGA is primarily a wage-earning activity.
2. It provides guaranteed 100 days of employment.
3. Work is available at the doorstep.
4. NREGA offers higher wages than market wages.
5. It is a government provided job.
6. It offers equal wages to men and women.
7. NREGA work does not require any special skills.
An assessment of the importance of the NREGA in the workers’ household and how it had impacted their lives, if any, was made from the question: if they were free to work under the NREGA, how many days would they like to work? The last question has already been discussed and the responses have already been detailed in the section on Work demand through direct question. The other two responses are presented. (See Table 13)
For a majority of the sampled workers across the three districts the NREGA was very important: Amritsar (60.9 per cent ), Hoshiarpur (64.2 per cent) and Muktsar (75.0 per cent). There were however responses which said the NREGA was somewhat important. This probably was the reflection of the very few number of days of employment being made available to such workers across the districts. Also, if the NREGA has brought any change in workers’ life, the responses provide mixed results. Both significant and no significant changes have been shown by workers in Amritsar and Muktsar in about equal measure. The Hoshiarpur results show a relatively better impact.
When we set this low level of employment generation and the workers’ high hopes from the NREGA against the levels of awareness of the workers about their entitlements and education of sarpanches which is a fair indicator of the information-searching, we find that our workers have very poor levels of awareness and our surpanches are also not from a well-educated group from the village communities. Both the level of awareness of workers and the education levels of sarpanches are given below.
Workers Awareness Issues
Before presenting the sampled workers’ responses on the levels of awareness of their entitlements, the workers’ primary source of information is presented in Chart 10 where 142 (83.1 per cent) respondents of Amritsar, 169 (94.5 per cent) of Hoshiarpur and 132 (71.1 per cent) of Muktsar said Gram Panchayats were the main source of their information about the NREGA.


Note:*=In order to substantiate the claim the workers were given a choice to make from: If it has prevented migration, hunger in the family, contributed to make payment for children schooling, cover medical expenses and if it has helped mitigating indebtness. Majority of the respondents opted for consumption needs of the family only as the primary contribution of the NREGA to their family.
When Gram Pnachayats play such a pivotal role in popularising the scheme, it is natural to expect that GP would simultaneously make an attempt themselves or through programme officers and his team to educate workers on their entitlements and strictly observe all provisions of the Act so that the Act generates enough work to impact on poverty and deprivation. A vibrant panchayat will also activate the Panchayati Raj Institutions by encouraging participatory democratic decision-making. The responses received on the awareness of their entitlements to work on demand (through work application not necessarily written) guaranteed 100 days of employment, minimum wages, payment of wages within 15 days and other entitlements are provided in Table 14.
Workers’ entitlement to get work on demand in Hoshiarpur is relatively reasonable (74.9 per cent) compared to the other two districts: 32.5 per cent in Amritsar and 41.3 per cent in Muktsar. Similar responses were obtained on 100 days of employment: 67.0 per cent from Hoshiarpur, 13.6 per cent from Amritsar and 25.5 per cent from Muktsar. Workers’ awareness level of their entitlement to minimum wages and payment of wages within 15 days is no better among workers in all the three districts. This becomes clear when among the other options on their understanding on minimum wages and payment of wages within 15 days reveal minimum wages between Rs 200-300 per day were responded by 19.5 per cent in Amritsar and 84.8 per cent in Hoshiarpur and 16.8 per cent of Muktsar workers. Likewise payment of wages within one week were responded by 43.3 per cent of workers in Amritsar, 68.7 per cent of Hoshiarpur and 34.8 per cent of Muktsar workers. Continuing with the entitlement awareness, the Act provides for accountability provisions where the State Government is required to pay compensation to the worker for delayed payment of wages, unemployment allowance if work is not provided within 15 days of application for work, and payment of transport allowance if the worksite is five kilometres away from the residence of the worker. We tried to capture the responses of the sampled workers on workers’ awareness on their entitlement of payment of unemployment allowance and transport allowance. (See Table 14) Here also the Hoshiarpur district relatively performed better on the awareness of workers’ entitlement but not sufficient enough to generate pressure for realisation of their entitlements, that is, even a higher level of awareness has failed to generate enough work. (See Chart 9)
Although there are wide variations in the level of awareness of workers, the level of awareness across districts is itself certainly not of correct responses. This raises questions on the responses of workers on their entitlements to get work on demand and for 100 days. This becomes clear when the work application process for work demand is examined. (See Tables 15 and 16)

The data of Tables 15 and 16 reveal that the work application process was yet not in place and instead workers kept waiting for the works to start implying that the works were supply dependent. On the application process for work demand, the observation of the survey team makes it absolutely clear the respect the NREGA authorities have accorded to the demand for work application. In this regard the following should be noted:
According to the NREG officials, a simple printed form had been created to enable job-card holders to demand work. However, those forms could not be located even in the district NREG offices, let alone the question of their availability with the Sarpanch at the village. No system was in place to receive demand for work and issue the job-card holder a receipt for the same. The seriousness of the NREG implementers in enabling the receipt of work applications therefore remains suspect.
Better awareness on the demand for work and their entitlement for 100 days of employ-ment, as shown by workers in the Hoshiarpur district, at best could be attributed to the fact that the NREGA was implemented in this district in the first year of this scheme’s implementation which might have been used by the district authorities to popularise the scheme. The correctness or otherwise of the entitlement responses is made more robust by converting the responses into an awareness index.
Awareness Index
We took six awareness questions and each was given two values 1 for correct answer and 0 for wrong answer. The six scores were added to give an awareness index. Hoshiarpur district produced the highest level of awareness followed by Muktsar and Amritsar.
The awareness index so created provide us a clearer picture and reconfirms that workers in Hoshiapur exhibit more than reasonable level of awareness as compared to the other two districts. In fact the awareness index is about thrice that of Amritsar and more than twice that of Muktsar. (Chart 11) Hoshiarpur’s own awareness index was about 2.5 on a scale of six.


Educational Level of Sarpances
The level of education of sarpanches provided in Table 17 reveals that nearly 50 per cent and 75 per cent of the sampled Gram Panchayat sarpanches in Amritsar and Muktsar have either not completed even Class V or have studied between Class V and Class IX. It was only in Hoshiarpur district that 75 per cent of the sarpanches had completed Class X or had acquired education beyond Class X.

Interpreting Ground Realities for NREGA’s Performance
The low level of awareness among workers and education among sarpanches are enough to help create information asymmetry though differen-tially across districts about the design of the Act. This, on the one hand, will prevent the workers to realise their entitlements of getting work on demand and, on the other, will prevent sarpanches in discharging their responsibility in providing 100 days of employment by creating the NREGA projects. As seen, even the Hoshiarpur district sarpanches’ education level has not helped in creating sufficient number of days of employment. There is evidence to suggest the inefficient performance of the NREGA works. The Punjabi Agricultural University’s Ago Economic Research Centre (2011) shows NREGA projects undertaken getting spilled over and the study of Raghubendra Jha (2013) shows large gaps between planned and actual expenditure incurred on the NREGA projects. Both these evidences are a pointer of the forces of local level politics playing on the minds of the sarpanches to either go slow on creating NREGA projects or operate the ongoing works inefficiently leading to low creation of employment opportunities.
These ground realities will come handy to the landowning classes to wean away workers from NREGA works and also not allow sarpanches to create NREGA works in the village.
References
Dreze, J. and Amartya Sen (2013): An uncertain Glory: India and its Contradictions, Allen Lane: An imprint of Penguin Books.
Government of India (2012): MGNERGA Sameeksha: An Anthology of Research Studies on the Mahatma Gandhi National Rural Employment Guarantee Act 2005, New Delhi: Orient Blackswan.
Malorano, D. (2014): ‘The Politics of Mahatma Gandhi Rural Employment Guarantee Act in AP’, World Development, 58, 95-105.
Manor, J. (2010): ‘What Do They Know of India Who Only India Know? The Uses of Comparative Politics’, Commonwealth and Comparative Politics, 48(4) 505-516
Raghubendra, Jha (2013): India’s National Rural Employment Guarantee Scheme at it is — Interpreting the Official Data ASARCWP 2012/12, Amended 2nd February
Reddy, Amrender (2015): ‘Growth, Structural Change and Wage Rates in Rural India’, EPW, January 10.
Sharma, S.C. (2014): ‘Impact of NREG Scheme on Rural Economy : A Case Study of Three Districts of Punjab’, UGC, GoI, New Delhi.
Vatta, Kamal, D.K. Grover and T. Grover (2011): ‘Impact of NREGA on Wage Rates, Food Security and Rural-Urban Migration in Punjab’, Report submitted to Ministry of Agriculture, GOI, Agro-economic Research Centre, Punjab Agricultural University, Ludhiana
Footnotes
1. Percentage of workers in Table 2 under the category “other” are those from Christian households.
2. 83.7 per cent of the sampled workers in Hoshiarpur are from SC households and are comparatively better off as nearly half (51.4 per cent ) live in pukka houses and only 25.7 per cent are illiterate as compared to 64.5 per cent in Amritsar and 76.6 per cent in Muktsar.
3. The information contained in the above table, particularly that on landholding size, was extremely difficult to get, a break-up of households owning different size groups of land is therefore not reported here. The data on landless respondent households and households owning some land is more authentic.
4. Among the livestock owning households a majority of them were maintaining cows and or buffaloes and the main purpose was domestic consumption of milk. A few households across the three districts reported more than three livestocks. A few among this category of households either used milk for market or looked after the animals of their landlords as they work in a lock-in system such as that prevailing in Muktsar.
5. According to the data posted on the NREGA website, out of the 11 lakh job-card holders (10.92 lakhs) in 2014-15 as many as 5.1 lakh job cards were inactive.